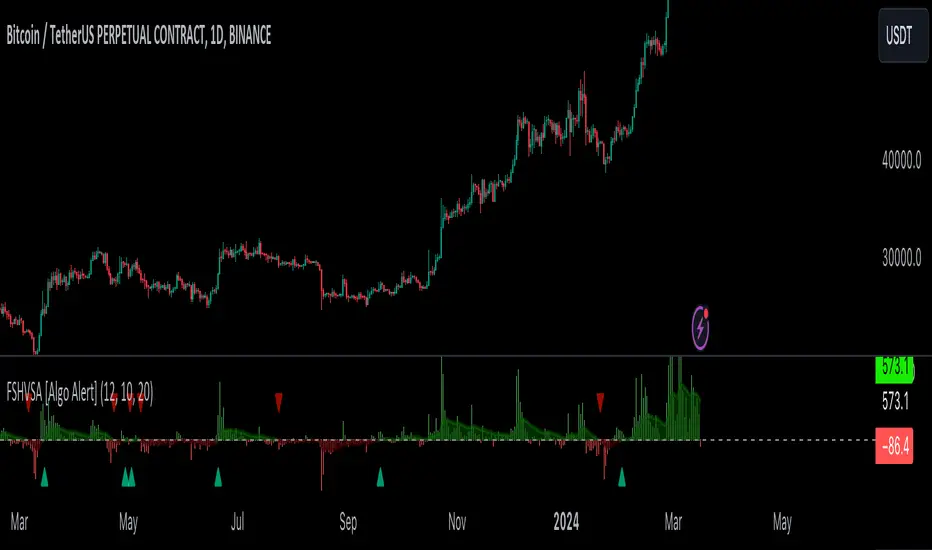
Fourier Smoothed Hybrid Volume Spread AnalysisIndicator id:
USER;91bdff47320b4284a375f428f683b21e
(only relevant to those that use API requests)
MEANINGFUL DESCRIPTION:
The Fourier Smoothed Hybrid Volume Spread Analysis (FSHVSA) indicator is an innovative trading tool designed to fuse volume analysis with trend detection capabilities, offering traders a comprehensive view of market dynamics.
This indicator stands apart by integrating the principles of the Discrete Fourier Transform (DFT) and volume spread analysis, enhanced with a layer of Fourier smoothing to distill market noise and highlight trend directions with unprecedented clarity.
This smoothing process allows traders to discern the true underlying patterns in volume and price action, stripped of the distractions of short-term fluctuations and noise.
The core functionality of the FSHVSA revolves around the innovative combination of volume change analysis, spread determination (calculated from the open and close price difference), and the strategic use of the EMA (default 10) to fine-tune the analysis of spread by incorporating volume changes.
Trend direction is validated through a moving average (MA) of the histogram, which acts analogously to the Volume MA found in traditional volume indicators. This MA serves as a pivotal reference point, enabling traders to confidently engage with the market when the histogram's movement concurs with the trend direction, particularly when it crosses the Trend MA line, signalling optimal entry points.
It returns 0 when MA of the histogram and EMA of the Price Spread are not align.
HOW TO USE THE INDICATOR:
The FSHVSA plots a positive trend when a positive Volume smoothed Spread and EMA of Volume smoothed price is above 0, and a negative when negative Volume smoothed Spread and EMA of Volume smoothed price is below 0. When this conditions are not met it plots 0.
ORIGINALITY & USEFULNESS:
The FSHVSA is unique because it applies DFT for data smoothing, effectively filtering out the minor fluctuations and leaving traders with a clear picture of the market's true movements. The DFT's ability to break down market signals into constituent frequencies offers a granular view of market dynamics, highlighting the amplitude and phase of each frequency component. This, combined with the strategic application of Ehler's Universal Oscillator principles via a histogram, furnishes traders with a nuanced understanding of market volatility and noise levels, thereby facilitating more informed trading decisions.
DETAILED DESCRIPTION:
My detailed description of the indicator and use cases which I find very valuable.
What is the meaning of price spread?
In finance, a spread refers to the difference between two prices, rates, or yields. One of the most common types is the bid-ask spread, which refers to the gap between the bid (from buyers) and the ask (from sellers) prices of a security or asset.
We are going to use Open-Close spread.
What is Volume spread analysis?
Volume spread analysis (VSA) is a method of technical analysis that compares the volume per candle, range spread, and closing price to determine price direction.
What does this mean?
We need to have a positive Volume Price Spread and a positive Moving average of Volume price spread for a positive trend. OR via versa a negative Volume Price Spread and a negative Moving average of Volume price spread for a negative trend.
What if we have a positive Volume Price Spread and a negative Moving average of Volume Price Spread ?
It results in a neutral, not trending price action.
Thus the indicator returns 0.
In the next Image you can see that trend is negative on 4h, neutral on 12h and neutral on 1D. That means trend is negative .
I am sorry, the chart is a bit messy. The idea is to use the indicator over more than 1 Timeframe.
What is approximation and smoothing?
They are mathematical concepts for making a discrete set of numbers a
continuous curved line.
Fourier and Euler approximation of a spread are taken from aprox library.
Key Features:
Noise Reduction leverages Euler's White noise capabilities for effective Volume smoothing, providing a cleaner and more accurate representation of market dynamics.
Choose between the innovative Double Discrete Fourier Transform (DTF32) and Regular Open & Close price series.
Mathematical equations presented in Pinescript:
Fourier of the real (x axis) discrete:
x_0 = array.get(x, 0) + array.get(x, 1) + array.get(x, 2)
x_1 = array.get(x, 0) + array.get(x, 1) * math.cos( -2 * math.pi * _dir / 3 ) - array.get(y, 1) * math.sin( -2 * math.pi * _dir / 3 ) + array.get(x, 2) * math.cos( -4 * math.pi * _dir / 3 ) - array.get(y, 2) * math.sin( -4 * math.pi * _dir / 3 )
x_2 = array.get(x, 0) + array.get(x, 1) * math.cos( -4 * math.pi * _dir / 3 ) - array.get(y, 1) * math.sin( -4 * math.pi * _dir / 3 ) + array.get(x, 2) * math.cos( -8 * math.pi * _dir / 3 ) - array.get(y, 2) * math.sin( -8 * math.pi * _dir / 3 )
Fourier of the imaginary (y axis) discrete:
y_0 = array.get(x, 0) + array.get(x, 1) + array.get(x, 2)
y_1 = array.get(x, 0) + array.get(x, 1) * math.sin( -2 * math.pi * _dir / 3 ) + array.get(y, 1) * math.cos( -2 * math.pi * _dir / 3 ) + array.get(x, 2) * math.sin( -4 * math.pi * _dir / 3 ) + array.get(y, 2) * math.cos( -4 * math.pi * _dir / 3 )
y_2 = array.get(x, 0) + array.get(x, 1) * math.sin( -4 * math.pi * _dir / 3 ) + array.get(y, 1) * math.cos( -4 * math.pi * _dir / 3 ) + array.get(x, 2) * math.sin( -8 * math.pi * _dir / 3 ) + array.get(y, 2) * math.cos( -8 * math.pi * _dir / 3 )
Euler's Smooth with Discrete Furrier approximated Volume.
a = math.sqrt(2) * math.pi / _devided
b = math.cos(math.sqrt(2) * 180 / _devided)
c2 = 2 * math.pow(a, 2) * b
c3 = math.pow(a, 4)
c1 = 1 - 2 * math.pow(a, 2) * math.cos(b) + math.pow(a, 4)
filt := na(filt ) ? 0 : c1 * (w + nz(w )) / 2.0 + c2 * nz(filt ) + c3 * nz(filt )
Usecase:
First option:
Leverage the script to identify Bullish and Bearish trends, shown with green and red triangle.
Combine Different Timeframes to accurately determine market trend.
Second option:
Pull the data with API sockets to automate your trading journey.
plot(close, title="ClosePrice", display=display.status_line)
plot(open, title="OpenPrice", display=display.status_line)
plot(greencon ? 1 : redcon ? -1 : 0, title="position", display=display.status_line)
Use ClosePrice, OpenPrice and "position" titles to easily read and backtest your strategy utilising more than 1 Time Frame.
Indicator id:
USER;91bdff47320b4284a375f428f683b21e
(only relevant to those that use API requests)
Search in scripts for "the strat"
[TTI] Mike Webster Quick Break, QuickSand & Grateful Dead RS📜 ––––HISTORY & CREDITS–––
This TradingView script, " Mike Webster (Webby) Quick Break, Quicksand & Grateful Dead RS," is inspired by the trading methodology developed by Mike Webster. The concept was shared by Webster in a Twitter post, where he emphasized the strategy's role in managing a core position in a winning stock. Webster's approach is unique as it is based on Relative Strength (RS) line movements and their interaction with fast and slow moving averages. Credits go to Mike Webster for the foundational concept and to the script developer for adapting it into this practical tool.
🦄 –––UNIQUENESS–––
The uniqueness of this script lies in its innovative use of the Relative Strength line in conjunction with two distinct moving averages. It features three key stages:
"Quick Break," where the RS line crosses the fast-moving average;
"Quicksand," where the RS line moves lower than its level during the "Quick Break";
"Grateful Dead Break," where the RS line crosses the slow-moving average.
This approach offers a dynamic and nuanced method to manage positions in trending stocks. The indicator plots little triangle shapes above the bars/candles, which violate the rules. Colors can be changed in settings.
🎯 ––––WHAT IT DOES––––
The script monitors and signals three critical phases in stock holding based on the Relative Strength line and moving averages.
👉First, the "Quick Break" indicates a potential short-term weakening in trend strength.
👉Following this, the "Quicksand" condition suggests a further decline in relative performance, prompting a more defensive stance.
👉Finally, the "Grateful Dead Break" signals a more significant trend reversal, potentially warranting the liquidation of the position.
These signals are visualized as shapes plotted on the chart for easy recognition.
🛠️ ––––HOW TO USE IT––––
To use this indicator, traders should input their desired index for RS comparison and adjust the moving average lengths and types according to their strategy. The default settings are an 8-period fast moving average and a 21-period slow moving average, but these can be modified. The script generates alerts for each of the three conditions - Quick Break, Quicksand, and Grateful Dead Break - aiding traders in decision-making. It is crucial to note that this tool is designed for managing a core position in a winning stock and should be used in conjunction with a comprehensive trading strategy. Testing and understanding the pros and cons of this method before implementation is advised, as emphasized by Mike Webster.

Backtest any Indicator v5Happy Trade,
here you get the opportunity to backtest any of your indicators like a strategy without converting them into a strategy. You can choose to go long or go short and detailed time filters. Further more you can set the take profit and stop loss, initial capital, quantity per trade and set the exchange fees. You get an overall result table and even a detailed, scroll-able table with all trades. In the Image 1 you see the provided info tables about all Trades and the Result Summary. Further more every trade is marked by a background color, Labels and Levels. An opening Label with the trade direction and trade number. A closing Label again with the trade number, the trades profit in % and the total amount of $ after all past trades. A green line for the take profit level and a red line for the stop loss.
Image 1
Example
For this description we choose the Stochastic RSI indicator from TradingView as it is. In Image 2 is shown the performance of it with decent settings.
Timeframe=45, BTCUSD, 2023-08-01 - 2023-10-20
Stoch RSI: k=30, d=40, RSI-length=140, stoch-length=140
Backtest any Indicator: input signal=Stoch RSI, goLong, take profit=9.1%, stop loss=2.5%, start capital=1000$, qty=5%, fee=0.1%, no Session Filter
Image 2
Usage
1) You need to know the name of the boolean (or integer) variable of your indicator which hold the buy condition. Lets say that this boolean variable is called BUY. If this BUY variable is not plotted on the chart you simply add the following code line at the end of your pine script.
For boolean (true/false) BUY variables use this:
plot(BUY ? 1:0,'Your buy condition hold in that variable BUY',display = display.data_window)
And in case your script's BUY variable is an integer or float then use instate the following code line:
plot(BUY ,'Your buy condition hold in that variable BUY',display = display.data_window)
2) Probably the name of this BUY variable in your indicator is not BUY. Simply replace in the code line above the BUY with the name of your script's trade condition variable.
3) Save your changed Indicator script.
4) Then add this 'Backtest any Indicator' script to the chart ...
5) and go to the settings of it. Choose under "Settings -> Buy Signal" your Indicator. So in the example above choose .
The form is usually: ' : BUY'. Then you see something like Image 2
6) Decide which trade direction the BUY signal should trigger. A go Long or a go Short by set the hook or not.
Now you have a backtest of your Indicator without converting it into a strategy. You may change the setting of your Indicator to the best results and setup the following strategy settings like Time- and Session Filter, Stop Loss, Take Profit etc. More of it below in the section Settings Menu.
Appereance
In the Image 2 you see on the right side the List of Trades . To scroll down you go into the settings again and decrease the scroll value. So you can see all trades that have happened before. In case there is an open trade you will find it at the last position of the list.
Every Long trade is green back grounded while Short trades are red.
Every trade begins with a label that show goLong or goShort and its number. And ends with another label again with its number, Profit in % and the resulting total amount of cash.
If activated you further see the Take Profit as a green line and the Stop Loss as a orange line. In the settings you can set their percentage above or below the entry price.
You also see the Result Summary below. Here you find the usual stats of a strategy of all closed trades. The profit after total amount of fees , amount of trades, Profit Factor and the total amount of fees .
Settings Menu
In the settings menu you will find the following high-lighted sections. Most of the settings have a question mark on their right side. Move over it with the cursor to read specific explanation.
Input Signal of your Indicator: Under Buy you set the trade signal of your Indicator. And under Target you set the value when a trade should happen. In the Example with the Stochastic RSI above we used 20. Below you can set the trade direction, let it be go short when hooked or go long when unhooked.
Trade Settings & List of Trades: Take Profit set the target price of any trade. Stop Loss set the price to step out when a trade goes the wrong direction. Check mark the List of Trades to see any single trade with their stats. In case that there are more trades as fits in the list you can scroll down the list by decrease the value Scroll .
Time Filter: You can set a Start Time or deactivate it by leave it unhooked. The same with End Time .
Session Filter: here you can choose to activate it on weekly base. Which days of the week should be trading and those without. And also on daily base from which time on and until trade are possible. Outside of all times and sessions there will be no new trades if activated.
Invest Settings: here you can choose the amount of cash to start with. The Quantity percentage define for every trade how much of the cash should be invested and the Fee percentage which have to be payed every trade. Open position and closing position.
Other Announcements
This Backtest script don't use the strategy functions of TradingView. It is programmed as an indicator. All trades get executed at candle closing. This script use the functionality "Indicator-on-Indicator" from TradingView.
Conclusion
So now it is your turn, take your promising indicators and connect it to that Backtest script. With it you get a fast impression of how successful your indicator will trade. You don't have to relay on coders who maybe add cheating code lines. Further more you can check with the Time Filter under which market condition you indicator perform the best or not so well. Also with the Session Filter you can sort out repeating good market conditions for your indicator. Even you can check with the GoShort XOR GoLong check mark the trade signals of you indicator in opposite trade direction with one click. And compare your indicators under the same conditions and get the results just after 2 clicks. Thanks to the in-build fee setting you get an impression how much a 0.1% fee cost you in total.
Cheers

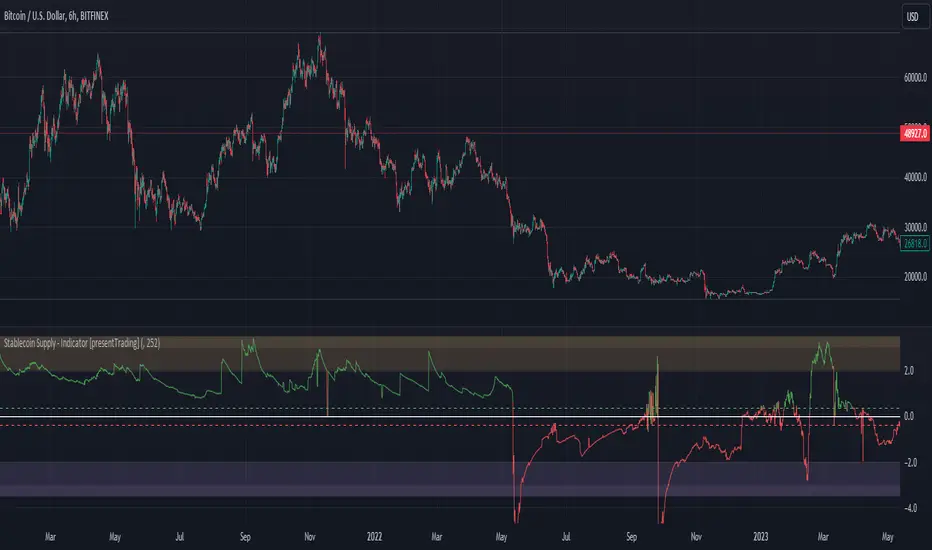
Crypto Stablecoin Supply - Indicator [presentTrading]█ Introduction and How it is Different
The "Stablecoin Supply - Indicator" differentiates itself by focusing on the aggregate supply of major stablecoins—USDT, USDC, and DAI—rather than traditional price-based metrics. Its premise is that fluctuations in the total supply of these stablecoins can serve as leading indicators for broader market movements, offering traders a unique vantage point to anticipate shifts in market sentiment.
BTCUSD 6h for recent bull market
BTCUSD 8h
█ Strategy, How it Works: Detailed Explanation
🔶 Data Collection
The strategy begins with the collection of the closing supply for USDT, USDC, and DAI stablecoins. This data is fetched using a specified timeframe (**`tfInput`**), allowing for flexibility in analysis periods.
🔶 Supply Calculation
The individual supplies of USDT, USDC, and DAI are then aggregated to determine the total stablecoin supply within the market at any given time. This combined figure serves as the foundation for the subsequent statistical analysis.
🔶 Z-Score Computation
The heart of the indicator's strategy lies in the computation of the Z-Score, which is a statistical measure used to identify how far a data point is from the mean, relative to the standard deviation. The formula for the Z-Score is:
Z = (X - μ) / σ
Where:
- Z is the Z-Score
- X is the current total stablecoin supply (TotalStablecoinClose)
- μ (mu) is the mean of the total stablecoin supply over a specified length (len)
- σ (sigma) is the standard deviation of the total stablecoin supply over the same length
A moving average of the Z-Score (**`zScore_ma`**) is calculated over a short period (defaulted to 3) to smooth out the volatility and provide a clearer signal.
🔶 Signal Interpretation
The Z-Score itself is plotted, with its color indicating its relation to a defined threshold (0.382), serving as a direct visual cue for market sentiment. Zones are also highlighted to show when the Z-Score is within certain extreme ranges, suggesting overbought or oversold conditions.
Bull -> Bear
█ Trade Direction
- **Entry Threshold**: A Z-Score crossing above 0.382 suggests an increase in stablecoin supply relative to its historical average, potentially indicating bullish market sentiment or incoming capital flow into cryptocurrencies.
- **Exit Threshold**: Conversely, a Z-Score dropping below -0.382 may signal a reduction in stablecoin supply, hinting at bearish sentiment or capital withdrawal.
█ Usage
Traders can leverage the "Stablecoin Supply - Indicator" to gain insights into the underlying market dynamics that are not immediately apparent through price analysis alone. It is particularly useful for identifying potential shifts in market sentiment before they are reflected in price movements. By integrating this indicator with other technical analysis tools, traders can develop a more rounded and informed trading strategy.
█ Default Settings
- Timeframe Input (`tfInput`): Allows users to specify the timeframe for data collection, adding flexibility to the analysis.
- Z-Score Length (`len`): Set to 252 by default, representing the period over which the mean and standard deviation of the stablecoin supply are calculated.
- Color Coding: Uses distinct colors (green for bullish, red for bearish) to indicate the Z-Score's position relative to its thresholds, enhancing visual clarity.
- Extreme Range Fill: Highlights areas between defined high and low Z-Score thresholds with distinct colors to indicate potential overbought or oversold conditions.
By integrating considerations of stablecoin supply into the analytical framework, the "Stablecoin Supply - Indicator" offers a novel perspective on cryptocurrency market dynamics, enabling traders to make more nuanced and informed decisions.
Universal Forecaster [SS Premium]This is the Universal Forecaster as part of the Elite level.
About:
The universal forecast creates autofitted models for most financial instruments using an ATR approach. It will provide a Bullish and Bearish threshold condition, prospective low targets and prospective high targets. It will autofit and no user inputs are required to manually adjust the parameters.
In addition to this, the indicator also has some build in functions to augment its functionality, including:
a) Built in Autoregression Forecaster;
b) Built in ARIMA plotter;
c) Built in Probability Assessor;
d) Ability to plot next day targets and thresholds;
e) Ability to expand targets up to 3 standard deviations from its projected levels;
d) Has the ability to generate models for most to all timeframes (from as low at 5 minutes to as high as yearly)
Functionality:
Off the bat, the indicator will provide you with the conditional levels and immediate target ranges. A break above a conditional level generally means a move to the high range and a break below, a move to the low range.
If a ticker extends beyond the immediate forecasted range, the indicator has the ability to expand the ranges (see example below):
It will do this automatically in response to a range exceedance.
The indicator anchors from the previous day close, which gives it the ability to show you the next day targets and thresholds:
In addition to being able to plot the next day targets, it is also capable of auto generating a probability assessment based on the model it creates:
The indicator provides 2 probability types, momentum probability which uses technicals and z-score probability which uses standard deviation:
It will display the backtest results as well as a break down of the similar cases identified (see image above).
If there are no cases, the indicator will alert you. You can then change the probability type to see if the other one can find cases:
Make sure when you are running the probability assessment, your chart matches the timeframe you are running the assessment for!
The indicator also provides a trade planner to help you ascertain high probability trades based on each unique ticker's behaviour. When toggled on, it will display the various condition possibilities, and the common resulting behaviour:
You can also get shorter timeframe levels, here is an example of hourly levels:
The indicator also works really well with most Crypto.
Here is BTC using weekly levels:
And ADAUSD using monthly levels:
In addition to running an autoregression forecast, you can also run an ARIMA plot directly from the indicator itself and have it plot the bullish or bearish case:
Bullish case:
Bearish case:
The indicator is intended as a stand-alone indicator and can be used as its own strategy. The strategy is fairly straight forward, a break and hold of the bullish conditional, long to the high targets, inverse for a break of the bearish.
Key take-aways and tips:
Can be used on all timeframes;
When running probabilities, please ensure that you are on the chart you are running the probabilities for. So if you are running for the next day, please make sure you are on the daily timeframe.
The ARIMA and Autoregression will default to whichever timeframe you are on.
And that is the indicator!
Let me know your questions below and enjoy!

SandTigerSandTiger is an auto-counting tool that counts naturally occurring events in a price series. This version has been reduced to 377 lines of code and should run faster than previous versions. Although not shown here, I highly recommend running my 'ELB' script with SandTiger. ELB is an 'event locator' and will mark all points that SandTiger numbers - giving you visual cues as to where these points are located. ELB also displays support/resistance levels.
SandTiger is designed to be used with MAGENTA - a counting system for Forex and other markets.
MAGENTA is a free and open framework for understanding and explaining price movement in financial markets. Any materials associated with MAGENTA are strictly for educational purposes only.
SandTiger tracks Component Values, Dyads, and Sum Table Values (STV's) over straight and curved trends, allowing a trader to discern where directional shifts are likely to occur.
SandTiger requires just 3 things to function accurately:
1) A correct starting point (this will typically be an obvious trend turn high or low in a series of price moves).
2) A 'push 1' count ('push 1' runs from the starting point to the event prior to the first terminal of the first FCT or Fractured Counter-Trend).
3) A 'high prime' value (the high prime count runs from the starting point through to the second terminal of the first FCT with no skips).
FRAMEWORK OVERVIEW: 'Component' values are filtered from the prime set (including the half prime and further reductions). Once we have the comp table we add the values to get a 'total'. With the 'total' we divide and multiply by two to get two additional values. 'Derivatives' are based on various calculations using these three values.
We're looking for 'total/2' to count into either itself, 'total', 'total*2', or a derivative. Comp counts are in Tx form and counted from trend start. If the trend doesn't turn on a comp value it will likely turn on a Dyad or STV value. If that also doesn't happen it's likely you have a 'curved' trend/sequence that will turn on one of the above after moving away from its high/low. This can also be traded using SandTiger's 'Seg Terminals' skip option.
Sum tables and Dyad values are drawn from the 'primes' and Dyads use the 'push1' value as well. In a structural trend, primes are gotten by counting pushpulls 1 & 2 in 'Ti' form. Comps, Sum table values, and Dyads are equivalent, sequences can turn on either value type belonging to the 1st or 2nd prime set. Both STV's and Dyads are counted in 'Tx' form (except where count-through signals occur).
Types and antitypes correlate and are associated with a 12-count 'cycle.' (Ti = 'Terminals Included'; Tx = 'Terminals eXcluded'; both refer to FCT terminals)
THE STRATEGY:
For Structures: Trade Comps, Dyads, and STV's from sets 1 (all) and 2 (Dyads and STV's only) in the 'main' segment then on the 'carry-over' by skipping segment terminals. If a PC or cycle caps the sequence, trade that as well.
For NSM's: Trade movements that flash a signal prior to the end of the initial cycle. The mark will be the push1 value. Twelve will be the 'high prime.' Skip interrupts and trade carry-over values.
The first version of SandTiger was conceived/planned/authored by Erek A.D. and coded by Erek A.D. and @SimpleCryptoLife beginning in August 2022 and finishing in Dec. 2022
The current version was written and developed July 3, 2023 and has been refined and upgraded by Erek A.D. through Jan. 2024...
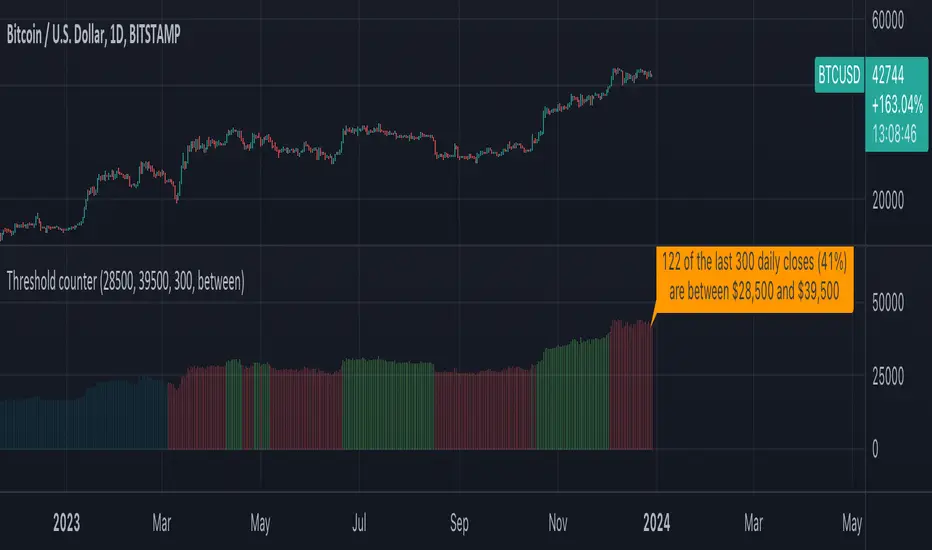
Threshold counterOVERVIEW
The "Threshold Counter" is a tool for quantifying occurrences of closing prices of an asset that align with specified criteria and is a flexible and visual approach to studying price action.
A user-definable target threshold can be set and a comparator (<, =, >, and so on) can be selected. The indicator counts values on the main chart meeting these conditions, over a user-defined `lookback` period.
KEY FEATURES
User definable threshold: target value with optional upper bound can be specified
Versatile Comparisons: Choose from "=", ">=", ">", "<=", "<", "between", and "between (inclusive)" for diverse analysis.
Historical Analysis: Assess occurrences over a customisable period.
Visual Representation: Displays instances graphically on the chart with customisable colours.
Summary: Provides a summary label for a quick understanding of the analysed data.
USE-CASES
Pattern Recognition: Identify patterns or trends based on user-defined price criteria.
Threshold Analysis: Quantify occurrences of prices crossing or staying within a specified range.
Strategy Testing: Evaluate historical performance of strategies relying on specific price conditions.
Behavioural Insights: Gain insights into price behaviour by counting occurrences of interest.
The "Threshold Counter" indicator offers a flexible and visual approach to studying price action, which may aid in making decisions based on historical data.
IMPORTANT CONSIDERATIONS
Period selection: The effectiveness of the analysis may be influenced by the choice of the lookback period. Consider an appropriate duration based on the strategy or pattern being analysed.
Comparator Selection: Comparison operator selection will obviously affect the results. There are two range operators of `between` and `between (inclusive)`. The latter will add closing prices that exactly meet the threshold and upper bound. The former does not.
Visualisation: Interpretation of the visual representation is colour-coded.
Red is threshold condition is not met.
Green is threshold condition is met.
Aqua is outside of the lookback period.
User Discretion: This script relies on historical data and should be used with caution. Past performance is not indicative of future results.
Supplementary Analysis: Trading decisions should not rely solely on this script. Users should exercise judgment and consider market conditions.
EMA Hafeezullah ReversalTitle: Enhanced EMA Breakout Strategy for Buy and Sell Signals
Description:
This script is an enhanced version of the traditional EMA (Exponential Moving Average) Breakout strategy, designed to provide clear buy and sell signals on price charts. The strategy revolves around a 5-period EMA, which helps traders identify potential breakout points in the market.
How It Works:
EMA Calculation: The script calculates a 5-period EMA, which smooths out price movements to identify the underlying trend.
Buy Signal Logic: A buy signal is generated when the previous candle closes below the EMA, and the current high is greater than the previous high. This indicates potential bullish momentum as the price breaks above the EMA.
Sell Signal Logic: A sell signal is triggered when the previous candle closes above the EMA, and the current close is lower than the previous low. This suggests bearish momentum as the price breaks below the EMA.
Cooldown Period: To avoid frequent signals and potential false breakouts, the script imposes a cooldown period. A new signal can only be generated if a certain number of bars (defined by cooldownBars) have passed since the last signal.
Signal Visualization: Buy signals are marked with green upward triangles below the bars, and sell signals with red downward triangles above the bars.
EMA Visualization: The 5-period EMA is plotted for reference, providing a visual representation of the current trend and potential breakout points.
Usage:
Ideal for intraday and short-term trading.
Can be applied to various asset classes including stocks, forex, and cryptocurrencies.
Best used in conjunction with other technical analysis tools for confirmation and to determine exit points.
Pine Script Version: The script is written in Pine Script version 5.
Originality and Usefulness:
This script stands out due to its simplicity and effectiveness in identifying breakout points. The addition of a cooldown period helps filter out noise and increases the reliability of the signals. It's a valuable tool for traders focusing on momentum and breakout strategies.

BreakoutTrendFollowingINFO:
The "BreakoutTrendFollowing" indicator is a comprehensive trading system designed for trend-following in various market environments. It combines multiple technical indicators, including Moving Averages (MA), MACD, and RSI,
along with volume analysis and breakout detection from consolidation, to identify potential entry points in trending markets. This strategy is particularly effective for assets that exhibit strong trends and significant price movements.
Note that using the consolidation filter reduces the amount of entries the strategy detects significantly, and needs to be used if we want to have an increased confidence in the trend via breakout.
However, the strategy can be easily transformed to various only trend-following strategies, by applying different filters and configurations.
The indicator can be used to connect to the Signal input of the TTS (TempalteTradingStrategy) by jason5480 in order to backtest it, thus effectively turning it into a strategy (instructions below in TTS CONNECTIVITY section)
DETAILS:
The strategy's core is built upon several key components:
Moving Average (MA): Used to determine the general trend direction. The strategy checks if the price is above the selected MA type and length.
MACD Filter: Analyzes the relationship between two moving averages to confirm the trend's momentum.
Consolidation Detection: Identifies periods of price consolidation and triggers trades on breakouts from these ranges.
Volume Analysis: Assesses trading volume to confirm the strength and validity of the breakout.
RSI: Used to avoid overbought conditions, ensuring trades are entered in favorable market situations.
Wick filters: make sure there is not a long wick that indicates selling pressure from above
The strategy generates buy signals when several conditions are met concurrently (each one of them can be individually enabled/disabled)"
The price is above the selected MA.
A breakout occurs from a configurable consolidation range.
The MACD line is above the signal line, indicating bullish momentum.
The RSI is below the overbought threshold.
There's an increase in trading volume, confirming the breakout's strength.
Currently the strategy fires SL signals, as the approach is to check for loss of momentum - i.e. crossunder of the MACD line and signal line, but that is to everyone to determine the exit conditions.
The buy and SL signals are set on the chart using green or orange triangles on the below/above the price action.
SETTINGS:
Users can customize various parameters, including MA type and period, MACD settings, consolidation length, and volume increase percentage. The strategy is equipped with alert conditions for both entry (buy signals) and exit (set stop loss) points, facilitating both manual and automated trading.
Each one of the technical indicators, as well as the consilidation range and breakout/wick settings can be configured and enabled/disabled individually.
Please thoroughly review the available settings of the script, but here is an outline of the most important ones:
Use bar wicks (instead of open/close) - the ref_high/low will be taken based on the bar wicks, rather than the open/close when determining the breakout and MA
Enter position only on green candles - additional filters to make sure that we enter only on strong momentum
MA Filter: (enable, source, type, length) - general settings for MA filter to be checked against the stock price (close or upper wick)
MACD Filter: (enable, source, Osc MA type, Signal MA type, Fast MA length, Slow MA length, Low MACD Hist) - detailed settings for fine MACD tuning
Consolidation:
Consolidation Type: we have two different ways of detecting the consolidation, note the types below.
CONSOLIDATION_BASIC - consolidation areas by looking for the pivot point of a trend and counts the number of bars that have not broken the consolidation high/low levels.
CONSOLIDATIO_RANGE_PERCENT - identifies consolidation by comparing the range between the highest and lowest price points over a specified period.
So in summary the CONSOLIDATIO_RANGE_PERCENT uses a percentage-based range to define consolidation, while CONSOLIDATION_BASIC uses a count of bars within a high-low range to establish consolidation.
Thus the former is more focused on the tightness of the price range, whereas the latter emphasizes the duration of the consolidation phase.
The CONSOLIDATIO_RANGE_PERCENT might be more sensitive to recent price movements and suitable for shorter-term analysis, while CONSOLIDATION_BASIC could be better for identifying longer-term consolidation patterns.
Min consolidation length - applicable for CONSOLIDATION_BASIC case, the min number of bars for the price to be in the range to consider consolidation
Consolidation Loopback period - applicable for CONSOLIDATION_BASIC case, the loopback number of bars to look for consolidation
Consolidation Range percent - applicable for CONSOLIDATIO_RANGE_PERCENT, the percent between the high and low in the range to consider consolidation
Plot consolidation - enables plotting of the consolidation (only for debug purposes)
Breakout: (enable, low, high) - the definition of the breakout from the previous consolidation range, the price should be between to determine the breakout as successfull
Upper wick: (enable, percent) - defines the percent of the upper wick compared to the whole candle to allow breakout (if the wick is too big part of the candle we can consider entering the position riskier)
RSI: (enable, length, overbought) - general settings for RSI TA
Volume (enbale, percentage increase, average volume filter en, loopback bars) - percentage of increase of the volume to consider for a breakout. There are two modes - percentage increase compared to the previous bar, or percentage against the average volume for the last loopback bars.
Note that there are many different configuration that you can play with, and I believe this is the strength of the strategy, as it can provide a single solution for different cases and scenarios.
My advice is to try and play with the different options for different markets based on the approach you want to implement and try turning features on/off and tuning them further.
TTS SETTINGS (NEEDED IF USED TO BACKTEST WITH TTS):
The TempalteTradingStrategy is a strategy script developed in Pine by jason5480, which I recommend for quick turn-around of testing different ideas on a proven and tested framework
I cannot give enough credit to the developer for the efforts put in building of the infrastructure, so I advice everyone that wants to use it first to get familiar with the concept and by checking
by checking jason5480's profile www.tradingview.com
The TTS itself is extremely functional and have a lot of properties, so its functionality is beyond the scope of the current script -
Again, I strongly recommend to be thoroughly explored by everyone that plans on using it.
In the nutshell it is a script that can be feed with buy/sell signals from an external indicator script and based on many configuration options it can determine how to execute the trades.
The TTS has many settings that can be applied, so below I will cover only the ones that differ from the default ones, at least according to my testing - do your own research, you may find something even better :)
The current/latest version that I've been using as of writing and testing this script is TTSv48
Settings which differ from the default ones:
Deal Conditions Mode - External (take enter/exit conditions from an external script)
🔌Signal 🛈➡ - BreakoutTrendFollowing: 🔌Signal to TTS (this is the output from the indicator script, according to the TTS convention)
Order Type - STOP (perform stop order)
Distance Method - HHLL (HigherHighLowerLow - in order to set the SL according to the strategy definition from above)
The next are just personal preferences, you can feel free to experiment according to your trading style
Take Profit Targets - 0 (either 100% in or out, no incremental stepping in or out of positions)
Dist Mul|Len Long/Short- 10 (make sure that we don't close on profitable trades by any reason)
Quantity Method - EQUITY (personal backtesting preference is to consider each backtest as a separate portfolio, so determine the position size by 100% of the allocated equity size)
Equity % - 100 (note above)

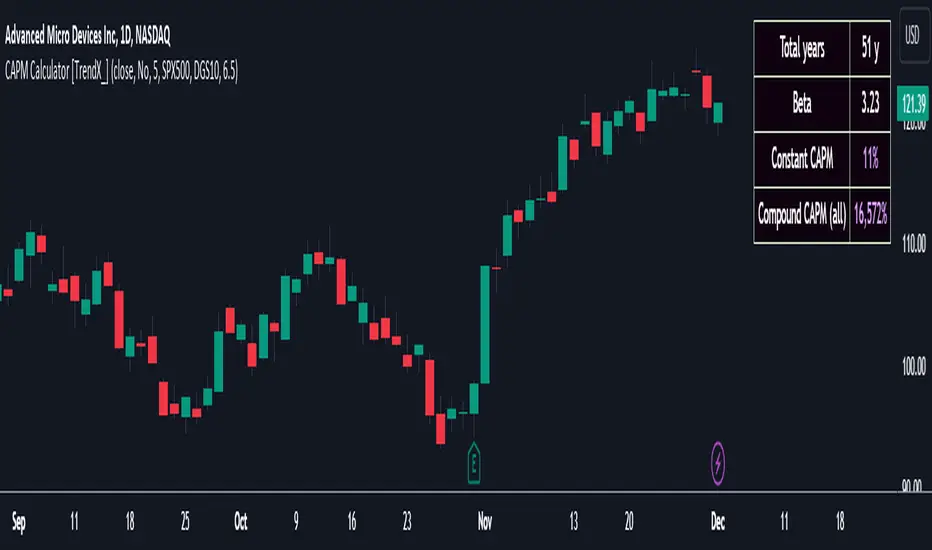
CAPM Calculator [TrendX_]CAPM calculator is a powerful tool that helps find the cost of equity, which is the minimum return that shareholders require to invest in a company.
With the CAPM calculator, you can assess how well your trading strategy performs compared to the market. The goal of your strategy is to earn higher returns than what you would get by investing in the market with the same level of risk. This is called the risk-adjusted cost of capital, and it represents the minimum return that you should accept for your investment.
USAGE
A simple way to measure this is to compare the Compound annual growth rate (CAGR) of the trading strategy with the “Compound CAPM”, which is the CAGR of investing in the market with the same beta as the strategy.
If the trading strategy has a higher CAGR than the “Compound CAPM”, it means that it has outperformed the market on a risk-adjusted basis.
This is a sign of an effective trading strategy.
DISCLAIMER
The results achieved in the past are not all reliable sources of what will happen in the future. There are many factors and uncertainties that can affect the outcome of any endeavor, and no one can guarantee or predict with certainty what will occur.
Therefore, you should always exercise caution and judgment when making decisions based on past performance.
Backtester UtilityLook ahead bias is the most evil bias responsible for overestimation of the performance of the trading system.
As the Bar replay feature is only available to paid users which is a great tool for manual testing of the trading system. Leaving other users prone to the evil of Look ahead bias.
So that I have developed this indicator which will help users to manually backtest the strategies.
This indicator hides the price action after specified date and time.
Here are the steps for using the indicator.
1) Hide your chart manually.
2) Plot the indicator.
3) Change the input of time and date after which you want to hide price action.
4) Change the script according to your trading strategy.
5) Enjoy the free of cost manual backtesting.
Good trading buddies !
Note : This post is only for educational purpose , it does not contain any financial advise.
Zemog Channels[Zemogtrading]Channels Strategy
User Description:
This Channels strategy is a powerful technical analysis tool that empowers traders with a comprehensive view of the market's support and resistance levels. Designed for both beginners and experienced traders, this strategy brings a systematic and adaptable approach to chart analysis.
Default Parameters:
Swing Length (SL): 45
Higher Timeframe: Daily (D)
Multiplier for Level 2: 3.5
Multiplier for Level 3: 12
How It Works:
Swing Analysis: The Swing Length (SL) parameter allows users to fine-tune the sensitivity of the strategy. A higher SL value provides a more smoothed-out analysis, ideal for a broader market perspective, while a lower value enhances responsiveness to short-term price movements.
Higher Timeframe Insights: The Channels fetches high and low prices from a user-specified higher timeframe (default: Daily). This ensures that the strategy is well-informed by significant price levels from a broader market context.
Dynamic ATR Calculation: The Average True Range (ATR) adapts dynamically to changing market conditions. This ensures that support and resistance levels adjust in real-time based on the prevailing volatility, providing traders with adaptive insights.
Smoothed Support and Resistance: Utilizing a Smoothed Moving Average (SMA), the strategy calculates support and resistance levels based on high and low prices from the higher timeframe. This smoothing effect enhances clarity in identifying key levels, facilitating more informed trading decisions.
Additional Levels: The Channels introduces Level 2 and Level 3 support and resistance zones. Users can customize multipliers for these levels, allowing for the identification of secondary zones for potential market reversals.
Visualization: The strategy vividly plots support and resistance levels on the chart. Green lines indicate support, red lines denote resistance, and yellow lines represent additional support at Level 3.
Using Channels is a versatile tool that equips traders with a deeper understanding of crucial market levels. By seamlessly integrating swing analysis, higher timeframe data, and adaptive calculations, this strategy offers a holistic and user-friendly approach to technical analysis.

Flat Combo DetectorFlat Combo Detector (FCD)
Introduction:
The Flat Combo Detector is a unique tool crafted to aid traders in identifying potential trend reversals. Unlike standard indicators that primarily focus on moving averages or oscillators, the FCD bases its signals on specific candlestick patterns that manifest at crucial trend pivot points.
I use it mostly on OANDA:XAUUSD Gold
How It Works:
The logic of the Flat Combo Detector revolves around the formation of consecutive bearish and bullish candles with particular attributes:
Bearish to Bullish Transition:
Primary Candle : A bearish candle where the close is lower than the open and its close is equal to its low.
Following Candle: A bullish candle where the close is higher than the open, and the open approximates its low (within a user-defined tolerance).
Signal : A green triangle plotted below the price bar, indicating a potential shift from a bearish to bullish trend.
Bullish to Bearish Transition:
Primary Candle: A bullish candle where the close is higher than the open and equals its high.
Following Candle : A bearish candle where the close is lower than the open, and the open approximates its high (within a user-defined tolerance).
Signal : A red triangle plotted above the price bar, indicating a potential transition from a bullish to bearish trend.
Usage Guidance:
For traders unfamiliar with Pine Script, using this indicator is straightforward. Once added to the chart, look for the green and red triangle signals. A green triangle below a price bar suggests a possible bullish reversal, while a red triangle above a price bar hints at a potential bearish reversal. Always consider these signals in conjunction with other technical analysis tools and the broader market context to optimize decision-making.
Associated Strategy:
I've also developed a trading strategy that utilizes these specific entry points identified by the FCD. If you find the signals from this indicator helpful, you might also be interested in exploring the strategy for a comprehensive trading approach. Always remember to backtest and validate any strategy before live trading.
Chart Presentation:
The published chart associated with this script has been kept clean to ensure clarity. Users will only observe the main price bars/candles along with the green and red triangle signals generated by the FCD.
Conclusion:
The Flat Combo Detector provides traders with a fresh perspective on trend reversal points. Its focus on specific candlestick patterns makes it a valuable tool, especially when used in combination with other technical indicators. Always ensure to practice prudent risk management and consult multiple analysis methods before making trading decisions.
Three Candle Rolling Pivot Range**Strategy Description: Three Previous Candle Rolling Pivot Range**
**Introduction:**
This trading strategy is based on the concept of the rolling pivot range calculated from the high, low, and close prices of the three previous candles. The rolling pivot range serves as a dynamic support and resistance level, and this strategy aims to capture potential trading opportunities based on the price relationship with this range.
**Strategy Components:**
**1. Rolling Pivot Range Calculation:**
- **Rolling Pivot:** Calculate the rolling pivot by averaging the high, low, and close prices of the three previous candles.
- **Second Number:** Find the midpoint between the high and low of the three previous candles.
- **Pivot Differential:** Measure the difference between the rolling pivot and the second number.
- **Rolling Pivot Range High:** Set as rolling pivot + pivot differential.
- **Rolling Pivot Range Low:** Set as rolling pivot - pivot differential.
**2. Entry Rules:**
- **Long Entry:**
- Initiate a long entry when the current close is above both the rolling pivot range high and the rolling pivot.
- Continue the long entry as long as both the rolling pivot range high and low are higher than the corresponding values of the previous candle.
- **Short Entry:**
- Start a short entry when the current close is below both the rolling pivot range high and the rolling pivot.
- Continue the short entry as long as both the rolling pivot range high and low are lower than the corresponding values of the previous candle.
**Visualization:**
- **Plotting:**
- The rolling pivot range high, rolling pivot, and rolling pivot range low are plotted on the chart for visual reference.
- Long entry points are marked with a green triangle below the corresponding candle.
- Short entry points are marked with a red triangle above the corresponding candle.
**Conclusion:**
This strategy leverages the rolling pivot range to identify potential reversal points in the market. By considering the relative position of the current price compared to the dynamic support and resistance levels, the strategy aims to capture favorable trading opportunities. However, like all trading strategies, it should be used cautiously and backtested thoroughly on historical data to ensure its effectiveness before implementation in a live trading environment. Additionally, risk management techniques should always be applied to safeguard trading capital.

MA RSI @KINGThis Pine Script is designed to create a trading indicator with moving averages (MA) and relative strength index (RSI), along with arrow signals and background color changes based on those signals. Here's a description of its functions:
1. Moving Averages and RSI Calculation:
- Two moving averages (`fastMA` and `slowMA`) are calculated based on user-input lengths.
- The Relative Strength Index (`rsi`) is calculated based on a user-defined length.
2. Crossover Conditions:
- `crossoverUp` is true when the fastMA crosses above the slowMA and RSI is above an overbought level.
- `crossoverDown` is true when the fastMA crosses below the slowMA and RSI is below an oversold level.
3. Arrow Signals:
- Triangle-shaped arrows (`arrowUp` and `arrowDown`) are plotted below and above bars, indicating buy (green) and sell (red) signals, respectively.
4. Background Color Changes:
- The background color (`bgColor`) changes based on buy and sell signals.
- If there's a buy signal (`crossoverUp`), the background color is set to a light blue with 40% transparency.
- If there's a sell signal (`crossoverDown`), the background color is set to a light red with 40% transparency.
- On the next opposite signal, the background color is scaled up (transparency set to 80%) to indicate a stronger signal.
In summary, this script provides visual cues through arrows and background color changes to assist traders in identifying potential buy and sell signals based on moving average crossovers and RSI conditions. The background color variations aim to highlight the strength of the signal, with scaling based on consecutive signals in the same direction.
********************************************************************************
1. Buy Signal:
- Condition: The arrow points up (green) with a background color indicating a buy signal.
- Confirmation: Ensure that there is a strong upward crossover (fastMA above slowMA) and RSI is above the overbought level.
2. Sell Signal:
- Condition: The arrow points down (red) with a background color indicating a sell signal.
- Confirmation: Ensure that there is a strong downward crossover (fastMA below slowMA) and RSI is below the oversold level.
3. Exit Signal:
- Condition: No arrow is present, and the background color is reset.
- Confirmation: Confirm that there is no active buy or sell signal.
Example Trading Rules:
Opening a Long Position (Buy):
- Enter a long (buy) position when:
- The green arrow appears with a light blue background.
- Confirm that the fastMA is above the slowMA.
- Confirm that RSI is above the overbought level.
Opening a Short Position (Sell):
- Enter a short (sell) position when:
- The red arrow appears with a light red background.
- Confirm that the fastMA is below the slowMA.
- Confirm that RSI is below the oversold level.
Exiting a Position:
- Close the position when:
- There is no arrow present (neither green nor red).
- The background color is reset, indicating no active signal.
Risk Management:
Position Sizing: Determine the size of your positions based on your risk tolerance and the size of your trading account.
Stop-Loss and Take-Profit: Set stop-loss orders to limit potential losses and take-profit orders to secure profits.
Risk-Reward Ratio: Consider maintaining a favorable risk-reward ratio in your trades.
Notes:
Backtesting: Before applying this strategy in a live market, it's crucial to backtest it using historical data to assess its performance.
Market Conditions: Adapt the strategy to different market conditions, and be aware that no strategy is guaranteed to be profitable.
Continuous Monitoring: Regularly monitor the performance of the strategy and make adjustments as needed.
Educational Purpose: This strategy is for educational purposes only. Always consult with financial professionals and use your judgment when making trading decisions.
Remember that trading involves risk, and past performance is not indicative of future results. It's recommended to paper trade or use a demo account to test the strategy before risking real capital.
Best wishes on your trading journey! May your strategies be profitable, your risks well-managed, and your decisions guided by wisdom and success. Happy trading!
Moving Average Cross trade PLAbstract
This script evaluates the potential trading proceeding and loss of the moving average cross strategy and plot it as a chart.
We can use it as a reference to whether we follow the original trading signals or not.
Introduction
Moving average cross is a popular trading strategy.
The strategy suggests traders buy when the short term moving average is above the long term moving average and sell when the short term moving average is below the long term moving average.
However, just like the most technical indicators, the signals are not always accurate.
This problem causes traders don't have sufficient confidence to trade with these signals.
On the other hand, the natural risk management suggests us only invest after major risks are past.
Therefore, we wait until many counterexamples of trading signals are past.
What will happen if we imagine that following a specific trading signal is a fund?
We can evaluate the potential trading proceeding and loss and plot it as a chart.
And then, we can measure how much loss may encounter in many worst cases and regard it as a reference to whether we follow the original trading signals or not.
How it works
1. Determine the instruments and time frames we are interested in.
2. Determine the long term moving average and the short term moving average.
3. The strategy suggests traders buy when the short term moving average is above the long term moving average and sell when the short term moving average is below the long term moving average.
4. The potential trading proceeding and loss is plotted as a chart.
5. There are two colors in the chart. One is when the short term moving average is above the long term moving average and the other is when the short term moving average is below the long term moving average.
6. We can observe the local maximum and the local minimum or apply other indicators we are interested in on the numbers it provides.
Parameters
x_type1 = How to compute the short term moving average. The option diff means the price several days ago.
x_src1 = How to summarize the price of a trading day. It depends on the open, high, low or close prices.
x_ma1 = How many days included in the short term moving average. When it is 1, the signal becomes when the price is above or below a single moving average.
x_type2 = How to compute the long term moving average
x_src2 = How to summarize the price of a trading day. It depends on the open, high, low or close prices.
x_ma2 = How many days included in the long term moving average
Conclusion
This indicator can quantize the potential trading proceeding and loss and can imply when following the original trading signals is good or not.
Combining the instruments which are long term investible and use this indicator to avoid potential risks, we can make proceeding better than holding the major stock markets.
Strategy - Relative Volume GainersStrategy - Relative Volume Gainers
Overview:
This trading strategy, called "Relative Volume Gainers," is designed for Long Entry opportunities in the stock market. The strategy aims to identify potential trading candidates based on specific technical conditions, including volume, price movements, and indicator alignments.
Strategy Rules:
The strategy is focused solely on Long Entry positions.
The volume for the current trading day must be greater than or equal to the volume of the previous day.
The percentage change in price must be greater than or equal to 2.5%.
The Last Traded Price (LTP) must be greater than or equal to the Exponential Moving Average (EMA) 200.
The Relative Volume for the current trading day (calculated over the last 30 days) must be greater than or equal to the Simple Moving Average (SMA) of Relative Volume over the same 30 days.
The current candle on the chart should be Green or Bullish, indicating positive price movement.
The price difference between bid and ask prices should be kept to a minimum.
It's recommended to also analyze market depth for better insights.
Strategy Requirements:
Add the Exponential Moving Average (EMA) 200 to your trading chart.
This strategy can be applied on charts of any timeframe.
For intraday trading, particularly for early entry, consider using a 1-minute timeframe.
It is advisable to create a screener to identify potential trades in real-time market conditions.
Risk Warning:
Stocks that meet the strategy criteria might exhibit high volatility and a high beta, making them inherently risky to trade. Exercise caution and adhere to predetermined risk management strategies.
Determine your trading quantity based on your entry price and stop loss in order to manage risk effectively.
Quantity Calculation Formula:
Quantity calculation is crucial to manage risk and position sizing. The following formulas can be used based on your trading scenario:
Quantity with Leverage:
Quantity = (((Using Capital / 100) * Risk Percent) / (Entry Price - Stop Loss)) * Leverage
Eg: Quantity = (((10000 / 100) * 0.2) / (405.5 - 398.5)) * 5
Quantity = 14
Risk = Rs.100 (Rs.100 is 1% of Rs.10000. So the risk is 1%, means we lose only Rs.100 when the SL is hit. If SL is increased the Quantity will get reduced to maintain a fixed risk of Rs.100)
Quantity without Leverage:
Quantity = (((Using Capital / 100) * Risk Percent) / (Entry Price - Stop Loss))
Note:
Always stay informed about market conditions and be prepared for potential rapid price movements when trading stocks that meet the strategy criteria. Strictly adhere to your predefined risk management strategy to safeguard your capital.

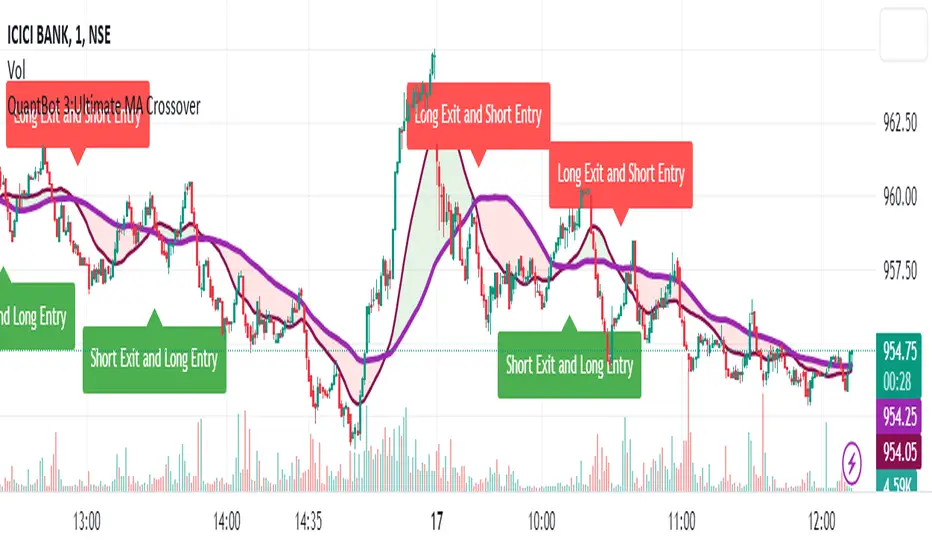
QuantBot 3:Ultimate MA CrossoverTHIS IS A SAMPLE CODE TO AUTOMATE WITH QUANTBOT
The moving average strategy is a popular and widely used technique in financial analysis and trading. It involves the calculation and analysis of moving averages, which are mathematical indicators that smooth out price data over a specified period. This strategy is primarily applied in the context of stock trading, but it can be used for other financial instruments as well.
The concept behind the moving average strategy is to identify trends and potential entry or exit points in the market. By calculating and analyzing moving averages of different timeframes, traders aim to capture the overall direction of the price movement and filter out short-term fluctuations or noise.
To implement the moving average strategy, a trader typically selects two or more moving averages with different periods. The most common combinations include the 50-day and 200-day moving averages. The shorter-term moving average is considered more reactive to price changes, while the longer-term moving average provides a smoother trend line. When the shorter-term moving average crosses above the longer-term moving average, it generates a buy signal, indicating a potential upward trend. Conversely, when the shorter-term moving average crosses below the longer-term moving average, it generates a sell signal, indicating a potential downward trend.
Traders can use various variations of the moving average strategy based on their trading objectives and risk tolerance. For instance, some traders may prefer to use exponential moving averages (EMAs) instead of simple moving averages (SMAs) to give more weight to recent price data. Others may incorporate additional indicators or filters to confirm signals or avoid false signals.
One of the strengths of the moving average strategy is its simplicity and ease of interpretation. It provides a clear visual representation of the trend direction and potential entry or exit points. However, it's important to note that the moving average strategy is a lagging indicator, meaning that it relies on past price data. Therefore, it may not always accurately predict future market movements or capture sudden reversals.
Like any trading strategy, the moving average strategy is not foolproof and carries risks. It is crucial for traders to conduct thorough analysis, consider other relevant factors, and manage their risk through proper position sizing and risk management techniques. Additionally, it's important to adapt the strategy to specific market conditions and combine it with other complementary strategies or indicators for improved decision-making.
Overall, the moving average strategy serves as a valuable tool for traders to identify and follow trends in financial markets, aiding in the analysis of price movements and potential trading opportunities.
SMA mechanical swing tradeIndicator that compares the closing price of an asset vs a simple moving average as a mechanical swing trading strategy. It allows the user to set any asset and timeframe for the strategy, which can be different from those the user is currently viewing. The strategy also allows the user to set an upside and downside tolerance so that retests within a few % of the SMA get some space to breathe before flipping directional bias.
If the selected asset in the strategy is different from the one currently viewed, the indicator plots the MA for the currently viewed asset but keeps applying the directional bias colors from the strategy asset.
Some examples of recommended usage of this indicator: BTCUSD 120D, BTCUSD 120D applied on ETHUSD, AAVEUSD 365D.

RAM StrategyThe name RAM originated because of three popular technical indicators Relative Strength Index (RSI), Average True Range (ATR), and Moving average convergence/divergence were used all together to create three conditions individually first and once all three conditions meet at once then we considered a potential opportunity either for buy or sell and produce signals. Before we dive into how the strategy work let's clarify all the 3 indicators which has been used.
RSI (Relative Strength Index):
The RSI is a popular indicator used to assess the overbought and oversold conditions of a financial instrument. It measures the speed and change of price movements.
Overbought Level: The RSI Overbought Level is set to 65, indicating that when the RSI goes above this level, it suggests that the instrument may be overbought or overvalued.
Oversold Level: The RSI Oversold Level is set to 35, indicating that when the RSI goes below this level, it suggests that the instrument may be oversold or undervalued.
ATR (Average True Range):
The ATR is a volatility indicator that measures the average range between the high and low prices of a financial instrument. It provides insight into market volatility. There is an ATR calculation and ATR Simple Moving Average calculation done in the script which provides insights into market volatility. By comparing the current ATR value to its SMA, this indicator takes into consideration the volatility conditions while generating trading signals, aiming to capture potential price movements during periods of increased volatility.
MACD (Moving Average Convergence Divergence):
The MACD is a trend-following momentum indicator that helps identify potential trend reversals. It consists of two lines: the MACD Line and the Signal Line.
MACD Line: The MACD Line represents the difference between the short-term and long-term moving averages. Crossovers of the MACD Line above the Signal Line indicate potential buying opportunities.
Signal Line: The Signal Line is a moving average of the MACD Line. Crossovers of the MACD Line below the Signal Line indicate potential selling opportunities and crossovers of the MACD line above the signal line indicate potential buying opportunities.
Trading Strategy:
Buy Signal: A buy signal is generated when the RSI is below the oversold level, the ATR is higher than its Simple Moving Average (indicating higher volatility), and there is a bullish crossover of the MACD Line above the Signal Line.
Sell Signal: A sell signal is generated when the RSI is above the overbought level, the ATR is higher than its Simple Moving Average (indicating higher volatility), and there is a bearish crossover of the MACD Line below the Signal Line.
The plot shapes function is used to visually represent the buy and sell signals on the price chart. Green "BUY" labels are displayed below the price bars for buy signals, while red "SELL" labels are displayed above the price bars for sell signals.
This strategy aims to identify potential buying and selling opportunities based on the combination of RSI, ATR, and MACD indicators. However, please note that the effectiveness and profitability of the strategy may vary depending on market conditions and individual trading preferences.
*Disclaimer*
Trading involves risk. Also, clarify that past performance is not indicative of future results and that individuals should only trade with the capital they can afford to lose.

Intraday Mean Reversion Money Performance indicatorThe diagram shows Money Performance when buying stocks for 10 000 at every buy signal from the Intraday Mean Reversion indicator.
The indicator is best used in combination with Intraday Mean Reversion Main Indicator
The rules for trading are: Buy on Open price if the Intraday Mean Reversion Main indicator gives a buy signal. Sell on the daily close price.
According to my knowledge it is not possible to create a PineScript strategy based on these rules, because the indicator is used on Day to Day graph. Therefore this indicator can be used to analyze Money performance of this strategy.
The lines show the performance of the Intraday Mean Reversion Strategy, based on the different levels in the strategy (from 0.5 Standard deviation to 1.1 standard deviation)
Using this indicator it is possible to find stocks that often reverse towards mean after open.
Use this strategy on stocks with high positive performance. Do not use on stocks with negative performance.
Double Supertrend Entry with ADX Filter and ATR Exits/EntriesThe Double Supertrend Entry with ADX Filter and ATR Exits/Entries indicator is a custom trading strategy designed to help traders identify potential buy and sell signals in trending markets. This indicator combines the strengths of multiple technical analysis tools, enhancing the effectiveness of the overall strategy.
Key features:
Two Supertrend Indicators - The indicator includes two Supertrend indicators with customizable parameters. These trend-following indicators calculate upper and lower trendlines based on the ATR and price. Buy signals are generated when the price crosses above both trendlines, and sell signals are generated when the price crosses below both trendlines.
ADX Filter - The Average Directional Index (ADX) is used to filter out weak trends and only generate buy/sell signals when the market exhibits a strong trend. The ADX measures the strength of the trend, and a customizable threshold level ensures that trades are only entered during strong trends.
ATR-based Exits and Entries - The indicator uses the Average True Range (ATR) to set profit target and stop-loss levels. ATR is a measure of market volatility, and these levels help traders determine when to exit a trade to secure profit or minimize loss.
Performance Statistics Table - A table is displayed on the chart, recording and showing the total number of winning trades, losing trades, percentage of profitable trades, average profit, and average loss. This information helps traders evaluate the performance of the strategy over time.
The Double Supertrend Entry with ADX Filter and ATR Exits/Entries indicator is a powerful trend-following strategy that can assist traders in making more informed decisions in the financial markets. By combining multiple technical analysis tools and providing performance statistics, this indicator helps traders improve their trading strategy and evaluate its success.

Range Filter x Hull SuiteRange Filter x Hull Suite
This indicator is a hybrid of two popular indicators, with a twist; namely the Range Filter (Guikroth version) and the Hull Suite (by Insilico) .
Originally developed as a 1 minute trend following strategy and traded during the New York Session for it's typically high volume / likely trending nature, it provides entry signals based on the following logic:
For bullish entry signals:
The first bullish* candle (*defined by the Range Filter bar color logic, blue by default - which is not necessarily technically a bullish candle as defined by the OHLC values) which appears after the consolidation candles (also defined by the Range Filter bar color logic, orange by default), and where the Hull Suite moving average is also bullish.
For bearish entry signals:
The first bearish* candle (*defined by the Range Filter bar color logic, red by default - which is not necessarily technically a bearish candle as defined by the OHLC values) which appears after the consolidation candles (also defined by the Range Filter bar color logic, orange by default), and where the Hull Suite moving average is also bearish.
The indicator aims to filter out signals where possible consolidation is occurring and comes with styling options and alternative filter options such as a triple moving average trend detection method. Signals can also be filtered by a specific trading session. Standard options for the Range Filter and Hull Suite settings are also able to be customised within the settings menu.
Alerts
Various alerts are built-in, including the custom entry signals unique to this strategy.
Note : The above features listed above are accurate at the time of publishing, but may be altered in future.
Many thanks to guikroth & Insilico for sharing their open source indicators, and also to the original developer of the strategy itself for sharing it.
